Mostrando entradas con la etiqueta informatica forense. Mostrar todas las entradas

domingo, 1 de febrero de 2026

Herramientas de Investigación gratis (encuentra una persona por correo, por usuario o por número)


Tus datos ya andan rolando por ahí. Tus contraseñas probablemente ya valieron queso en alguna filtración. ¿Ese link raro que te mandó tu tía? Podría vaciarte la cuenta del banco.

______________________

VER HACKERS EN TIEMPO REAL (Mapas de Ataques)
¿Alguna vez quisiste ver los ciberataques ocurriendo *ahorita mismo*? Estos mapas visualizan la actividad global de hackeo como en película, pero es la neta.


Kaspersky Cybermap (Globo giratorio estilo Matrix)
https://cybermap.kaspersky.com/

Check Point ThreatMap (Limpio, tipos de ataque por país)
https://threatmap.checkpoint.com/

Bitdefender ThreatMap (Infecciones y ataques en vivo)
https://threatmap.bitdefender.com/

Digital Attack Map (DDoS visualizados, respaldado por Google)
https://www.digitalattackmap.com/

Fortinet Threat Map (Severidad y tipos de ataque)
https://threatmap.fortiguard.com/


______________________

FEEDS DE RANSOMWARE (Mira a Quién Hackearon)
Las pandillas de ransomware publican a sus víctimas. Estos sitios raspan esa info para que no tengas que meterte a la deep web.


ransomware.live (Raspado en tiempo real de sitios de filtración)
https://www.ransomware.live/

RansomLook (Perfiles de grupos, estadísticas)
https://www.ransomlook.io/

DarkFeed (Monitor de ransomware)
https://darkfeed.io/


______________________

¿YA ME HACKEARON? (Verificadores de Fugas)
Tu correo y contraseñas probablemente ya se filtraron. Estas herramientas te dicen dónde.


Have I Been Pwned (El clásico para checar correos)
https://haveibeenpwned.com/

HIBP Passwords (¿Tu contraseña exacta ya es pública?)
https://haveibeenpwned.com/Passwords

DataBreach.com (Correo, teléfono, usuario)
https://databreach.com

Mozilla Monitor (Escáner enfocado en privacidad)
https://monitor.mozilla.org/


______________________

¿QUÉ TAN RÁPIDO TRUENAN MI CONTRASEÑA?
Escribe tu contraseña y mira cuánto tarda una compu en adivinarla. Te vas a ir de espaldas.


Security.org Checker (Muestra el tiempo en años/segundos)
https://www.security.org/how-secure-is-my-password/

Password Monster (Desglose detallado de debilidades)
https://passwordmonster.com/

Bitwarden Tester (Limpio y confiable)
https://bitwarden.com/password-strength/

Kaspersky Checker (Checa contra contraseñas filtradas conocidas)
https://password.kaspersky.com/


______________________

¿ES SEGURO ESTE LINK? (Escáneres de URL)
¿Te llegó un link sospechoso? Pégalo aquí antes de darle clic. Checan malware, phishing y estafas.


urlscan.io (Escaneo profundo con capturas de pantalla)
https://urlscan.io/

VirusTotal (Más de 70 antivirus escanean la URL)
https://www.virustotal.com/

CheckPhish (Detección de phishing y typosquatting)
https://checkphish.bolster.ai/

URLVoid (Más de 30 motores de lista negra)
https://www.urlvoid.com/

Sucuri SiteCheck (Escaneo de malware y listas negras)
https://sitecheck.sucuri.net/


______________________

BUSCAR A CUALQUIERA POR USUARIO (OSINT)
Mete un nombre de usuario. Ve en qué otras plataformas existe ese vato. Busca en más de 1500 sitios.


WhatsMyName.io (1500+ plataformas, gratis)
https://whatsmyname.io/

SherlockOSINT (Sherlock con interfaz web)
https://sherlockosint.com/

Namecheckup (Disponibilidad en redes sociales)
https://namecheckup.com/

OSINT.sh (Multi-herramienta: IP, dominio, usuario)
https://osint.sh/


______________________


¿DE DÓNDE SALIÓ ESTE CORREO? (Analizadores)
Cada correo tiene encabezados ocultos que muestran su ruta. Pégalos aquí para rastrear la IP real del que te lo mandó.


Email Header Analyzer (Chequeos SPF/DKIM, geolocalización IP)
https://emailheaderanalyzer.com/

IPLocation Email Analyzer (Rastreo visual + mapa)
https://iplocation.io/email-header-analyzer

Trustifi Analyzer (Sube archivos .eml directamente)
https://trustifi.com/email-analyzer/


______________________
¿QUÉ ESCONDE ESTE ARCHIVO? (Metadatos y EXIF)
Cada foto o documento trae datos ocultos: coordenadas GPS, modelo del cel, hora. Checa esto antes de compartir algo.


EXIF.tools (Imágenes — GPS, cámara, fecha)
https://exif.tools/

Metadata2Go (Imágenes, docs, video, audio)
https://www.metadata2go.com/

Jimpl (EXIF de fotos + ubicación en mapa)
https://jimpl.com/


______________________

APRENDE A HACKEAR (Legalmente)
Sitios para tronar sistemas de verdad, pero legal. Puzzles y retos para aprender.


picoCTF (Principiante total, respaldado por CMU)
https://picoctf.org/

TryHackMe (Principiante a Intermedio)
https://tryhackme.com/

OverTheWire Wargames (Empieza con Bandit)
https://overthewire.org/wargames/

Hack The Box (Intermedio en adelante)
https://www.hackthebox.com/


______________________

MANTENTE INFORMADO
Donde los investigadores de seguridad leen las noticias. Sin relleno corporativo.


vx-underground (Muestras de malware, memes y confirmación de brechas)
https://vx-underground.org/

Darknet Diaries (Podcast de crimen real para hackers)
https://darknetdiaries.com/

BleepingComputer (Noticias de seguridad técnica, leíbles)
https://www.bleepingcomputer.com/


______________________

KITS TODO EN UNO (Navajas Suizas)
En lugar de tener 50 marcadores, estos sitios traen un montón de herramientas juntas.


OSINT.sh (IP, DNS inverso, tech stack, historial WHOIS)
https://osint.sh/

OSINT Framework (Árbol masivo de enlaces categorizados)
https://osintframework.com/


______________________

INVESTIGACIÓN DE MALWARE
¿Quieres ver cómo se ve un virus? Recursos educativos para investigadores. No descargues nada si no le sabes.


vx-underground (La colección más grande de muestras)
https://vx-underground.org/

MalwareBazaar (Intercambio de muestras de malware)
https://bazaar.abuse.ch/


______________________

Todas las herramientas son gratis. La mayoría no pide registro. No necesitas entrar a la dark web.

Fuente:
https://identi.io/index.php?topic=691845

martes, 3 de noviembre de 2015

Windows 8 Touch Keyboard Forensics

Microsoft released Windows 8 in 2012. With this new version, Microsoft made a fundamental shift in Windows 8 as compare to older versions of Windows. It does not only target netbooks, laptops and traditional computers, instead they decided to use the same technology in Windows 8 tablets. This is why Windows 8 operating system is far more touch screen oriented for use on tablets as well as traditional PCs.
According to Microsoft, ‘In Windows 8, a Windows pointer device refers to devices that support the pen, or touch, functionality. In the context of a Windows Pointer Device, a pen is a single contact point active stylus input, also known as tablet-pen that supports hovering. Touch functionality refers to a single finger contact point or two or more concurrent finger contacts.’ Windows pointer devices use HID (Human Interface Device) protocol to communicate with Windows operating system. Below snapshot shows the interface of the touch keyboard.
Image1-UI
Fig 1-1

Why Touch Keyboard Forensics?

Number of touch screen devices is increasing exponentially. According to a report from DisplayBank, shipments of touch screen equipped notebooks increased by 51.8% in Q1 2013 to 4.57 million units. Looking at the trend, it is quite obvious to expect more touch screen enabled laptops, PCs, and tablets in forensic labs for examination. Though the basic file structure remains same in Windows 8 as compare to its predecessors, but the huge difference in user interface and addition of new features and metro apps have introduced greater use of touch technology in the form of virtual keyboard and other touch enabled apps. Touch keyboard allows users to enter data on handwriting touch panel. This data is stored in ISF format containing details of user’s input, number of strokes etc. To understand it better, we can create an analogy between ISF file and a piece of paper note found while conducting a search for evidence. This might add another piece to the puzzle in investigation or turn out to be an important clue for handwriting analyst team. Thus, touch analysis deserves consideration in the field of forensics.

ISFViewer

In Windows, the InkStore folder, located at C:\Users\(username)\AppData\Local\Microsoft\InputPersonalization, contains ISF Files. ISF stands for Input Serialized Format. It is a Microsoft standard format to store written ink information. This format is specially used to store data entered using stylus in devices like mobile phones, tablet PCs, touch screen laptops, personal digital assistants.
According to Wikipedia “An ink object is simply a sequence of strokes, where each stroke is a sequence of points, and the points are X, and Y coordinates. Many of the new mobile devices can also provide information such as pressure, and angle. In addition can be used to store custom information along with the ink data.“
ISFViewer is written in C# and available at https://github.com/cybercuffs/ISFViewer. It takes a single ISF file or a folder with multiple ISF files as two different input options and converts them into GIF image format. The .gif file can later be viewed with Windows Photo Viewer or any other image viewer.
Img3-ISFViewer
Fig 1-2
Following screenshot depicts the output of the ISFViewer

Image4-Converted

Fig 1-3

Registry Artifacts

One can use the MS device manager in order to disable/enable the touch screen functionality. Fig 1-4 shows the device manager view of Windows 8 and 8.1. Note that in Windows 8, Microsoft labels all the devices as HID – Compliant Device that makes it a hit and try effort to turn the touch screen on/off. On the other hand Windows 8.1, adds the device name like ‘touch screen’ in front of HID – compliant device.
Image5-DM
Fig 1-4
Now look at the Fig 1-5 to see how the  two registry entries IsTabletPC and DeviceKind is changed.
Image6-Registry
Fig 1-5

References


Fuente: http://articles.forensicfocus.com/2015/09/04/windows-8-touch-forensics/

Microsoft Edge Browser Forensics – Exploring Project Spartan

Formerly known as Internet Explorer and then as Project Spartan, Microsoft Edge Browser has evolved a lot. From the User Interface to the technology it’s built upon, the browser has completely changed in its variant meant for Windows 10. This post will provide an insight into the artifacts left behind on the local machine by the successor to the Internet Explorer web browser. From the location, type and gathering of these artifacts, this post explains and throws light on all aspects of Edge Browser Forensics. However, you will discover that the functioning and backend of Project Spartan aka Edge Browser is no different from the Internet Explorer latest version. Let us take a look at it.

Starting With Browser Forensics

Web browsers are the primary source of undertaking most offensive activities online. Therefore, it also becomes the primary source of information in any digital forensics investigation case as well. Many open source applications can capably conduct forensic examination of most web browsers. Nevertheless, these applications work on the architecture of browsers and require working with them in order to detect and interpret their data.
Edge Browser And Its Forensics
Edge is the latest browser developed by Microsoft as a successor to Internet Explorer. However, being built specifically for Windows 10 its usage has all of a sudden risen due to the increasing number of the latest OS users. Edge Browser also leaves behind artifacts on the user machine in order to store browsing information.

Exploring Edge Storage: Moreover, compared to its predecessor, Edge browser by Microsoft no longer stores the browser related information like history, keyword searches, and similar information in an Index.DAT file. Previously, this information used to get stored within a file type with a .dat extension. On the other hand, the file was replaced in Edge to an ESE database like the one generated by Windows for storing information related to searches conducted on Windows Explorer.
The file type is known as an Extensible Storage Engine database file. Not just the browsing history, but also most of the other artifacts generated by this browser are stored in this format only. This database format is also popularly known as an EDB database or Jetblue, which is a technology that corroborates the database for Microsoft Search, Edge Browser and Cortana (a digital personal assistant developed Windows mobile and desktops) as well.

Unearthing The Artifacts: Edge ESE Database
Settings for Edge browser are stored in an ESE database, which is located on a Windows machine at the following folder path:

\Users\user_name\AppData\Local\Packages\Microsoft.MicrosoftEdge_xxxxx\AC\MicrosoftEdge\User\Default\DataStore\Data\nouser1\xxxxx\DBStore\spartan.edb

Even though the suspect might be using Edge browser, Windows 10 still has a provision for Internet Explorer version 11. Surprisingly the browsing history for both is stored at the same location, which is:

\Users\user_name\AppData\Local\Microsoft\Windows\WebCache\WebCacheV01.dat

Cached file location would be in the following directory path:
\Users\user_name\AppData\Local\Packages\Microsoft.MicrosoftEdge_xxxxx\AC\#!001\MicrosoftEdge\Cache\
Examining The Artifacts: Search for Evidence

As discussed previously, there are plenty of open source utilities available to offer a look inside the ESE Database on a standalone mode, i.e. without external support required. However, this entirely depends on the state in which the database is present. Being ESE database, in case of a dirty shutdown of the machine, there is high possibility of the extracted artifacts to be found in a dirty dismount state. Therefore, in that case, the examiner would first have to process it with Extensible Storage Engine Utilities provided by Microsoft Windows in order to further parse it in search of evidence.
History being the most majorly important database has been used an example for explaining the exploration of evidence in an ESE Database using a viewer or open source ESE DB reader.
Below are the tables that can be found within a History ESE database of Edge Browser:

AppCache_n
AppCacheEntry_n
Container_n
DependencyEntry_n
HstsEntry_n
LeakFiles
MSysLocales
MSysObjects
MSysObjectsShadow
MSysObjids
Partitions
Facts: Container_n tables store information like cookie detail, websites visited, cache file entry, and more, which is relevant and significant from investigative point of view. In addition, the timestamp recorded by ESE database is in Google’s Chrome Value format. In the local machine’s timezone, however, the information can be decoded using a decode utility or even the esedbexport tool can decode the value, if the examination is being performed with it.

What Complicates The Investigation?

A Twist in the Examination!
There is something quite unusual about Edge browser. Suppose you have logged onto your Windows 10 PC with a Microsoft Account and then later on you use the same account to log into some other PC. What happens here is that Microsoft chooses to synchronize your web browser’s history details across the devices logged in with the account.
Therefore, the websites visited by a suspect can be portrayed as the websites also visited by the victim at the very same time, making it tricky to make out who is who. Thus, the investigation is complicated.
There is no certain method from a forensics standpoint to find out the source machine for the captured details. This will resultantly make it challenging to pin down a user to a specific machine and thus, the root behind all the browsing history.

Edge-y Loophole: Private Browsing

The forensic examination of most web browsers has proven that they don’t have a provision for storing the details of privately browsed web sessions. Private browsing is provided for a purpose, i.e. privately browsing the web, which is being delivered.
However, in the case of Microsoft Edge even the private browsing isn’t as private as it seems. Previous investigations of the browser have resulted in revealing that websites visited in private mode are also stored in the browser’s WebCache file.
NOTE: The Container_n table stores web history. There a field named ‘Flag’ will be available. A website visited in the private mode will have a flag value as ‘8’. Generally the purpose of storing this information is to retrieve crashed private sessions.

\Users\user_name\AppData\Local\Microsoft\Windows\WebCache


Therefore any skilled investigator can easily spot the difference and get concrete evidence against a person’s wrongdoings. Plenty of artifacts are maintained by the browser, which makes examination quite easy. However, there are stages where evidence is not so easy to find. The not-so-private browsing featured by Edge makes its very purpose seem to fail.

Fuente: http://articles.forensicfocus.com/2015/10/14/microsoft-edge-browser-forensics-exploring-project-spartan/

Standard Processes in Windows 10

On the 29th of June, Microsoft announced  the release of Windows 10, so it is time to have a deeper look at this new Operating System from the perspective of an Incident Responder. To make it easier for you to read the screenshots, I have chosen USERNAME and HOSTNAME as names for themselves.
The tool Process Hacker (http://processhacker.sourceforge.net) still functions in Windows 10 and shows well-known process names, parent-child relationships and familiar faces from former Windows Operating Systems. But the familiarity is short-lived. Some players are new and some players have changed their position on the playground.
System still has the PID 4 and is the parent of the Windows Session Manager. I will also mention that it still resides at %systemroot%\system32\. All services are started from executable files from their former locations, if not mentioned otherwise in this article.
There are still two Client Server Runtime Processes (csrss.exe), one of which has the same parent as wininit.exe from an ended smss.exe process. Every additional user on this host (either as a “Switched User” or via Remote Desktop Connection) has its own Client Server Runtime Process since Windows NT.
Process view on a Windows 10 virtual machine

Some old and new changes

The super-process winit.exe spawns services.exe, lsass.exe and the invisible lsm.exe process to start the Local Session Manager. Starting from Windows 8, lsm.exe is started inside a Service Host process from svchost.exe from the command line %systemroot\system32\svchost.exe -k DcomLaunch.
The Local Session Manager Service lsm.exe does not show up in your preferred Task Viewer any longer as its own entry, but in the Services console as an “unchangeable” service.
The Local Session Manager has moved under the hood of svchost.exe
The WinLogon Service, which is responsible for Interactive Logons on a Windows Operating System,  remains where it has always been for Session 1 and is started for every interactive user session. The screenshot above shows only winlogon.exe, dwm.exe (the Desktop Window Manager) and one instance of explorer.exe per user session started. As was already changed between Windows 7 and Windows 8, the Desktop Window Manager no longer exists as a child of svchost.exe, executed with the credentials of the current user. In Windows 8 and 10 it is spawned from the Windows Logon process as user Window Manager\DWM-1 with the start of the Operating System. For every new user on the Host the digits count from DWM-2 and up.

Another new name for the Task Host

Renaming is another interesting topic. The Microsoft OneDrive Client Application called OneDrive.exe, started from %userprofile%\AppData\Local\Microsoft\OneDrive\OneDrive.exe, is a new starter on the playground of Windows for every new session. But why this is a 32-bit process on a 64-bit machine can only be answered by Microsoft. It must be a real secret; why shouldn’t it be possible to develop their Office 365 file sharing client in a 64-bit flavor? At least they renamed the client from Skydrive.exe to OneDrive.exe.
And Microsoft has renamed the Host Process for Windows Tasks again. In Windows 7 it was named taskhost.exe, in Windows 8 it was called taskhostex.exe and the new name is taskhostw.exe in Windows 10. A look at the name of the Taskhost process is sufficient to recognize the OS version from now on.
The primary purpose, serving as a generic “Host Process”, remains unchanged, as does the location in %systemroot%\system32\.

Surprise, Surprise

Let’s open some typical built-in applications and see what happens. In this case, I was executing cmd.exe from the “Run” dialog and started a Pathping against my own virtualized host machine. The Console Windows Host conhost.exe has been running as a child of cmd.exe since Windows 8, and not as a child of csrss.exe as it was in Windows 7. The executable file for Pathping is a child of cmd.exe in the same way conhost.exe is. There is no longer any separation of conhost.exe under the user’s own Client Server Runtime Service csrss.exe and the cmd.exe process under explorer.exe. If you open a second or third Command Prompt, Windows 10 opens a Console Window Host for each of them.
Win10.cmd.conhost.pathping
But you can have a whole new experience if you start the new Microsoft Edge web browser, the successor of Internet Explorer. Microsoft Edge starts four processes:
  • Two processes named MicrosoftEdgeCP.exe, started from C:\Windows\SystemApps\..\ with the permission of the current user. Microsoft Edge starts with two of them for the first visible tab inside the browser window. Both are child processes of RuntimeBroker.exe, which is a child of svchost.exe, the Host Process for Windows Services. Runtime Broker starts automatically with the Operating System.
    A new MicrosoftEdge process is started under the Runtime Broker Service for every new tab that is opened by the browser. Microsoft is also introducing the new path %systemroot%\SystemApps and starting a web browser as a sub-child of svchost.exe, which breaks traditions in the process design.
  • Directly spawned from svchost.exe is the process MicrosoftEdge.exe (without “CP” at the end of the file name). This is the main browser application process. And again, the executable file is saved in a subfolder of C:\Windows\SystemApps.
  • The Host Process svchost.exe starts a fourth executable file called browser_broker.exe.
    This time Microsoft is following its own design traditions and has stored the file in the well-known path %systemroot\system32\.
My personal Virtual Machine was a pre-release version, updated automatically to the RTM version of Windows 10. This might be the reason for the weird randomized-looking folder name for the Edge Browser.
A view of Edge and the corresponding processes
What is missing? Any process under the Explorer process. Despite MicrosoftEdge being a visible application on the Desktop, there are no processes spawned as a child of explorer.exe.
At first I thought there might be a problem with the Process Hacker tool I was using to enumerate the processes on this virtual Windows 10 machine. So I checked my findings locally on the virtualized host with Microsoft’s highly underestimated “Super Weapon”: WMIC.
My command was:
wmic process where “name like “%Edge%” OR name like “%broker%” OR ProcessID=”832″” get name,ProcessID,ParentProcessId
And this was the output:
Win10.EdgeCommandlineWMIC
In this case I queried for the PID 832 from svchost.exe to show you the relationship between all mentioned processes. If you follow all parent-child dependencies you can see the validation of the GUI-based output.
What does it look like if you use the Windows Task Manager?
MicrosoftEdge.exe, easily identified by the name of the executable file and the PID, shows up under “Apps” together with other foreground applications, despite it being started as a child of the svchost.exe process. As soon as you right click on this entry and check the properties for MicrosoftEdge.exe, a new dllhost.exe process called “COM Surrogate” is started from %systemroot%\system32\ with the permissions of the currently logged on user. Other user-specific services like csrss.exe are marked as Background processes.
The browser_broker process and the MicrosoftEdgeCP.exe instances are running under the tab “Background processes”, too. Since MicrosoftEdgeCP.exe and MicrosoftEdge.exe have the same shown description text and path from %systemroot%\SystemApps, they can only be identified on the Details pane by comparing the file names.
Win10.TaskMgr.ViewEdge

Conclusion

Microsoft maintains a lot of already known process structures, but has made some unusual decisions when it comes to the way their new web browser Edge is started. Hosting all related processes as a (sub-)child of an already shared Service Host instance doesn’t seem to be a logical decision. By introducing a new path for the stored executable files of Microsoft Edge under %systemroot%\SystemApps, the next needless confusion is created.
And confusion is a good topic to explore: renaming taskhost.exe to taskhostex.exe and then to taskhostw.exe is one example of something that makes it harder for Incident Responders to identify malware which tries to hide “in plain sight”. We can probably all hazard a guess at which names and similar-looking paths will be used in the near future by the creators of malware. But one thing did not change with the introduction of Windows 10: you need third-party tools to unveil what is really running on the Operating System.
Robin Brocks (GCFA, CISSP) is an IT Forensic Expert and Incident Responder 
He has been working in the field of IT Forensics for the last seven years and is an experienced IT Architect, Trainer and Consultant in the IT Business since 1998.
You can get in touch with him by emailing robin.brocks@brocks.de or on LinkedIn: https://de.linkedin.com/in/robinbrocks

Fuente: http://articles.forensicfocus.com/2015/08/06/standard-processes-in-windows-10/

SQLite Database Deleted Records Carving & Forensics

SQLite is a compact database engine highly integrated with embedded devices and locally used applications in various Operating Systems. Recent years have seen extensive usage of portable devices like tablets, smartphones, etc. and this has given rise to adaption of the SQLite application. It also amplifies the chances for surfacing digital evidence using forensic analysis of SQLite database files. Intentional deletion of crucial data from SQLite databases, which are embedded within the applications, can rarely be done by the average person. However, technically expert criminals can perform such tactics to avoid being discovered. In order to perform the deleted data recovery, it is important to understand some factors like structure and architecture of SQLite databases, how the records are stored in the pages of the databases, and how the databases align all the elements.
SQLite Database Structure
SQLite databases belonging to any application are structured with many pages of fixed size and a fixed number of bytes, which can be 1024, 2048, 4096, 8192, 16384, 32768 or 65536. The number of pages and size is declared in the header of the database. Official documents state that header of the page is stored in the first 100 bytes of the first page, and rest of the page structure is maintained. There are mainly 4 types of pages for SQLite databases, and the type can be detected by the first byte of each page, which occurs after the file header. The important row data of the database lies in a “Leaf Table B-Tree” type of page. It takes the flag value as 0xD i.e. 13 decimal.
In order to carve an entire SQLite record, it is important to analyze schema. If the page has overwritten the cell headers, the carving of data from the database including the deleted data can be difficult. However, when we perform the recovery on specific string content of the page, it can be conveniently done. File signature, which is an important element in any file format belonging to the SQLite file, is
File Signature: ‘‘0x53 51 4c 69 74 65 20 66 6f 726d 61 74 20 33 00’’

This file signature can help you to identify the SQLite database, as this file does not have any specific file extension. The header appears in the beginning of the file, which also contains the signature. The lower part will comprise of the schema table, which contains the table information.
After the header portion, the page comprises of b-trees, which are again separated into index b-tree and table b-tree. The data is stored in the table b-tree in cells, which act as an elementary unit of store operation. Cell structure and contents depend on the internal and leaf pages. The internal page is available in the middle section of the tree and the cells store the locators or pointers for locating the lower page. The leaf page is present in the bottom.
The structure of the schema table is comprised of specific schema names. The string, which appears after root page numbers, is SQL query. When investigators want to recover the deleted records, the table information has to be acquired using this SQL query associated with that table. Information in the schema is: table name, field name-type, and number of fields which are usually of four types; TEXT, NUMERIC, INTEGER, & BLOB.
SQLite Deleted Data Recovery from Journal Files
The transaction log file of the SQLite database serves as the best source for acquiring deleted records from the database. However, this process is valid and helpful only when the deleted records are available in the transaction log files. SQLite database system has a different management for the transaction log files and it creates a separate journal file named as “\database file name[/\file extension[-journal’’ when a query is sent to the associated database. Thus, it saves the history of inputs made and outcome results in the form of records before the query is completed on the main database. Forensic analysis of these journal files can bring out a lot of evidence if the records are still available in the journal files. However, modern investigation theories suggest that it is always better to perform the investigation on the records recovered directly from parent databases instead of journal files.
How is Record Deletion Managed in Application Software?
The management of record deletion in application software depends on the application and varies accordingly. The rules or directions for the deletion can be classified as: “Overwritten with zero”, “Remove deleted data”, or “Set as free”. Its recoverability methods and probability also change accordingly.
  • The first rule, where record deletion prompts overwriting with zero, is highly used in web-browsers like Safari, Chrome, Firefox, etc. In this case, the recovery of data is not possible even if the deleted data is identified.
  • The second rule is in the case of an iPhone, where the small sized data is deleted. When this type of deletion occurs, the whole area is deleted and then there is no way to trace the event of deletion.
  • The third rule is where the deleted data is set free and the data is still available in the system. This case includes examples like deleted messages in Skype messenger. When iPhone messages are deleted in bulk, this rule is also followed. In this case, deleted data still remains in the file and SQLite data recovery is possible if it is not overwritten.
Recovery Methodology
While performing recovery of deleted records from the SQLite database, it is important to identify the number of fields in the schema table and its type. Afterwards, the page can be scanned and the data within the unallocated area can be viewed. There can be different cases where the deleted data comprises of an independent record, more than two records, or if the data is partially overwritten.
Considering all the factors and cases, it can be presumed that recovery of SQLite databases depends on various aspects. Once the SQLite database is acquired from the respective locations of Windows, iPhone, Web Browsers, SmartPhones, Androids, etc. a python script can be executed against this attained database. Working on the required workstation with Python installed, users can easily perform this recovery process using a script such as the sqlparse python script developed by Mary DeGrazia.
These scripts can easily recover deleted cell records from the SQLite database and help in investigations. The output results, i.e. recovered deleted records, will then be saved in a text file.
Conclusion

SQLite database engine is used in multiple application softwares for saving data in databases. This includes Firefox, Chrome, Safari, iPhone OS, Android OS, Windows OS, Mac OS, Skype, Whatsapp, TweetDeck, etc. These databases can be of huge importance for forensic investigation as data related to SMS, call logs, cache, history, searches, web cookies, etc. is saved in these databases. In order to perform complete investigation on these SQLite databases, deleted data recovery is extremely important. The above-mentioned script can be helpful for investigators in order to analyze the deleted data.

Fuente: http://articles.forensicfocus.com/2015/10/15/sqlite-database-deleted-records-carving-forensics/

jueves, 29 de octubre de 2015

How to Retrieve Saved Password from RAW Evidence Image

First Download OS Forensic from here and install in your pc then open OSForensic and click on Create  Case  button to  create a new forensic case.
Now enter the details such as Case Name, Investigator Name, Default Drive, and Acquisition Type To specify the case folder, click on browse & select the Location where you want to save your Evidence Report. Now click on ok.
Now it will show us the registered case in this tool. Now to manage this case, click on Add Device option available in Manage Case.
Now select Image File option in Select Device to add option. Now assign the path of the folder where image file exists and also give the Display Name which is compulsory. Click on OK Button.
Now to get the saved browser password clicks on Find Browser Passwords Option and selects the Scan Drive option and then click on Retrieve Password. It will show you all saved passwords  in RAW Image.
Author: Mukul Mohan is a Microsoft Certified System Engineer in Security and Messaging with high level of expertise in handling server side operations based on windows platform. An experienced IT Corporate Trainer and Computer Forensics Expert with over 20 years’ Experience.

You can contact him at mukul@hackingarticles.in

Fuente: http://www.hackingarticles.in/how-to-retrieve-saved-password-from-raw-evidence-image/

miércoles, 26 de agosto de 2015

Mira mamá.. encontre un hash: Obteniendo passwords NT de un volcado de RAM.


Buenas, después de unas semanas del primer post, retomamos el blog.
Hace unos días, buscando unos PDF’s para sumar conocimientos en el área de informática forense, me tope con un libro interesante. “The Art of Memory Forensics”, un libro que apunta a la detección de malware y otras amenazas, en la memoria de sistemas Windows, Linux y Mac.

Una lectura interesante que comienza profundizando en terminologias y conceptos de hardware, estructura del sistema operativo, manejo de procesos y memoria entre otras tematicas y luego nos introduce a la acción y lo practico, que es a lo que vamos con el post de hoy; la adquisición del volcado de RAM y el análisis de la misma para obtener hashes del sistema (Windows en este caso).
Adquirir un volcado de la memoria RAM nos puede dar mucho jugo, del mismo podemos extraer información muy valiosa a la hora de un análisis forense, como conexiones establecidas, procesos en ejecución, comandos tipeados en el cmd, usuarios, contraseñas, registros de la caché, sistema de archivos, entre otros datos útiles en los que se requiere la preservación de la escena y VOLATILIDAD de la evidencia.
mem-analysis
Para esta prueba vamos a utilizar dos herramientas fundamentales:
– DumpIt.
– Volatility Framework.
DumpIt es un software para Windows que captura y almacena una imagen de la memoria RAM, el cual podemos descargar en su version free de su sitio web. Mientras que Volatility es un framework multiplataforma desarrollado en Python que permite la extracción de datos del volcado obtenido mediante un conjunto de scripts muy poderosos, es opensource y podemos obtener su código desde su repositorio en GitHub.
Para empezar, use como victima del análisis una PC de escritorio con Windows 7 de 32 bits.
Copiamos el ejecutable de DumpIt en un pendrive, lo introducimos en la maquina a analizar y lo ejecutamos.
 Al ejecutarlo, el mismo nos muestra el tamaño de la captura, la ruta donde se va a almacenar y nos pregunta si deseamos proceder. Una vez que aceptamos continuar, comienza el proceso de captura y lo almacena en un archivo de formato raw.
Una vez terminado, copiamos el archivo a la maquina donde vamos a analizar el fichero. En mi caso, una laptop con Debian donde tenemos instalado Volatility.
Primero que nada necesitamos obtener el perfil del volcado, para ello tiramos del comando
 volatility imageinfo -f archivo-de-captura.raw


Como vemos en la imagen superior, la herramienta comienza a generar la información necesaria para su posterior análisis.

En la primera linea de la información imprimida, podemos ver el id de perfil que necesitamos para continuar, en nuestro caso: Win7SP0x86.
Para obtener las direcciones de memoria donde se encuentran los hashes, tipeamos
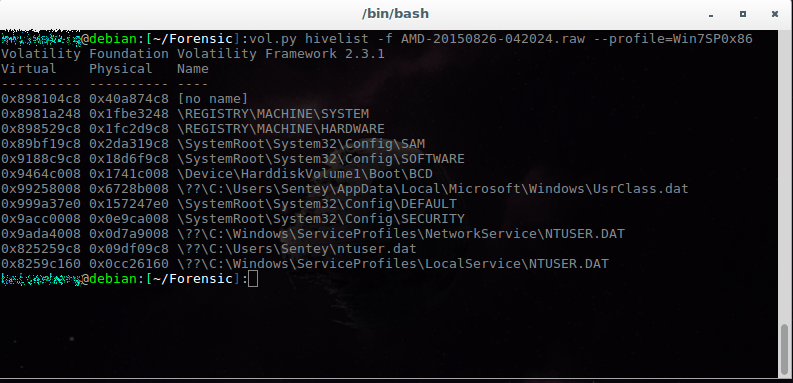
vol.py hivelist -f captura-de-ram.raw –profile=perfil-obtenido
Lo que nos imprime:

Ya tenemos la ruta de nuestro PRECIOOOOSO! }:)

A continuación vamos a hacer uso del script hashdump, para el que necesitamos establecer como parámetros la dirección virtual de SYSTEM y SAM como vemos en la imagen inferior, para obtener los preciados hashes de las cuentas del sistema.
vol.py -f AMD-20150826-042024.raw –profile=Win7SP0x86 hashdump -y 0x8981a248 -s 0x89bf19c8

Y.. TARAAANN!!! Ya tenemos las cuentas de usuario de la maquina comprometida, con sus respectivos hashes, los cuales posteriormente podemos crackear con herramientas como mimikatz, john the ripper u ophcrack.


Como pudimos ver, la memoria RAM almacena información muy relevante en estos casos (todo esto me recuerda a un tema de Leon Gieco) sin olvidar que hablamos de una herramienta muy poderosa a la hora de analizar una captura de RAM, que además de este script contiene muchos otros muy interesantes y prácticos. Dada por finalizada esta publicación, espero haberlos entretenido y que les sirva de algo.
Saludos, y pronto nos vemos en otro post! :)

Fuente: https://caffeinesec.wordpress.com/2015/08/26/mira-mama-encontre-un-hash-obteniendo-passwords-nt-de-un-volcado-de-ram/

jueves, 30 de julio de 2015

Bro: La herramienta de análisis forense de pcaps que debes conocer


Una de las partes fundamentales en el análisis dinámico de códigos maliciosos es la obtención de información a partir de una captura de tráfico. Para lograr este objetivo además de las opciones para hacer gráficos, el uso de filtros en Wireshark para detectar actividad maliciosa suele ser una de las alternativas más utilizada.

Pero no es la única herramienta para lograrlo, por ejemplo Malcom permite examinar estructuras de redes maliciosas facilitando el análisis de las relaciones entre las diversas direcciones IP, dominios y servidores DNS que toman parte en una comunicación C&C, permitiendo procesar rápidamente los datos recolectados y creando gráficos intuitivos que ponen en evidencia las conexiones entre equipos en red. Otra interesante opción para analizar archivos pcap es CapTipper, desarrollada en Python tiene una serie de características que facilita la lectura de estos archivos permitiendo ahorrar tiempo y optimizando el trabajo de auditoría.

Dentro de todo el arsenal de herramientas que se podrían encontrar para realizar este tipo de actividades encontramos Bro, pensado como un sistema de detección de intrusiones (IDS) que corre en plataformas UNIX/Linux y cuyo principal objetivo es permitir el análisis del tráfico de red en busca de actividad sospechosa. Ya de hecho la habíamos utilizado para extraer información de archivos pcap y visualizar las capturas de tráfico de botnets con OpenGraphiti, además de servir para procesar y simplificar la identificación de patrones entre los bots durante la Operación Liberpy.

Dado que es una herramienta bastante útil y que por su facilidad para hacer scripts resulta bastante flexible y adaptable, sobre todo para el análisis forense de una gran cantidad de datos. Vamos a hacer escribir una serie de post con información de cómo utilizar Bro y algunas ideas que podrían resultar relevantes.

Bro 101: Por dónde empezar

Esta herramienta permite analizar la actividad de red a nivel de aplicación para ir comparando este comportamiento con patrones que pudieran ser considerados sospechosos ya sea por el tipo de paquetes que se intercambien o las características de su contenido.

Para iniciar nuestros análisis solo debemos ejecutar el comando para copiar el repositorio directamente desde GitHub. Con estos además de asegurarnos que tenemos la última versión se nos facilitará su actualización:

git clone --recursive git://git.bro.org/org

Una vez tenemos el repositorio en nuestra máquina, solo nos queda instalar algunas dependencias
 y ejecutar la instalación de nuestra herramienta. Esta herramienta es 
conocida por sus funcionalidades de IDS, pero en este caso nos va 
interesar darle una mirada a las características para extraer 
información de las capturas de tráfico.

Dentro de las características que vale la pena resaltar en la capacidad para analizar grandes volúmenes de tráfico. El funcionamiento de la herramienta como ya lo mencionamos se hace a través de scripts, con los cuales se hace la extracción de información que se esté buscando.

Como resultado de aplicar Bro sobre un archivo pcap resultan varios archivos con información más específica y organizada de acuerdo a las características de cada script. Utilizando la opción más básica de Bro podemos obtener una gran cantidad de información discriminada por protocolos:

bro –r [ruta_archivo_pcap]

Ahora tenemos varios archivos con la información organizada de diferentes manera. Por ejemplo en el archivo http.log
 se pueden encontrar filtradas las peticiones HTTP de la captura de 
tráfico. Como se puede ver en la siguiente imagen, algo que puede llamar
 la atención durante un análisis es la descarga de un archivo 
ejecutable:

http.log_WLS

El string que está resaltado en amarillo, nos va a permitir hacer seguimiento de este evento en particular a través de los demás archivos generados por la herramienta. Por ejemplo si vamos al archivo conn.log y buscamos esta cadena de caracteres vamos a obtener más información sobre la conexión como el momento en que se llega el primer paquete, las ip y puertos utilizados, la duración de la conexión, el origen de la conexión, entre otra información que podría resultar interesante para el análisis:

conn.log_WLSHasta este punto con el manejo de Bro podemos obtener información similar a la que podríamos encontrar en otras herramientas como Wireshark o CapTipper, solo que organizada de una manera diferente. En nuestro próximo post, vamos a ver como apoyarnos en scripts de Bro para reunir información de diferentes fuentes y que nos quede disponible para su análisis.


Créditos imagen: © Mike Mozart/Flickr
Fuente: http://www.welivesecurity.com/la-es/2015/07/30/bro-la-herramienta-de-analisis-forense-de-pcaps-que-debes-conocer/